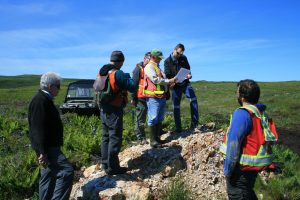
Maps showing location and outline of the Heritage Project

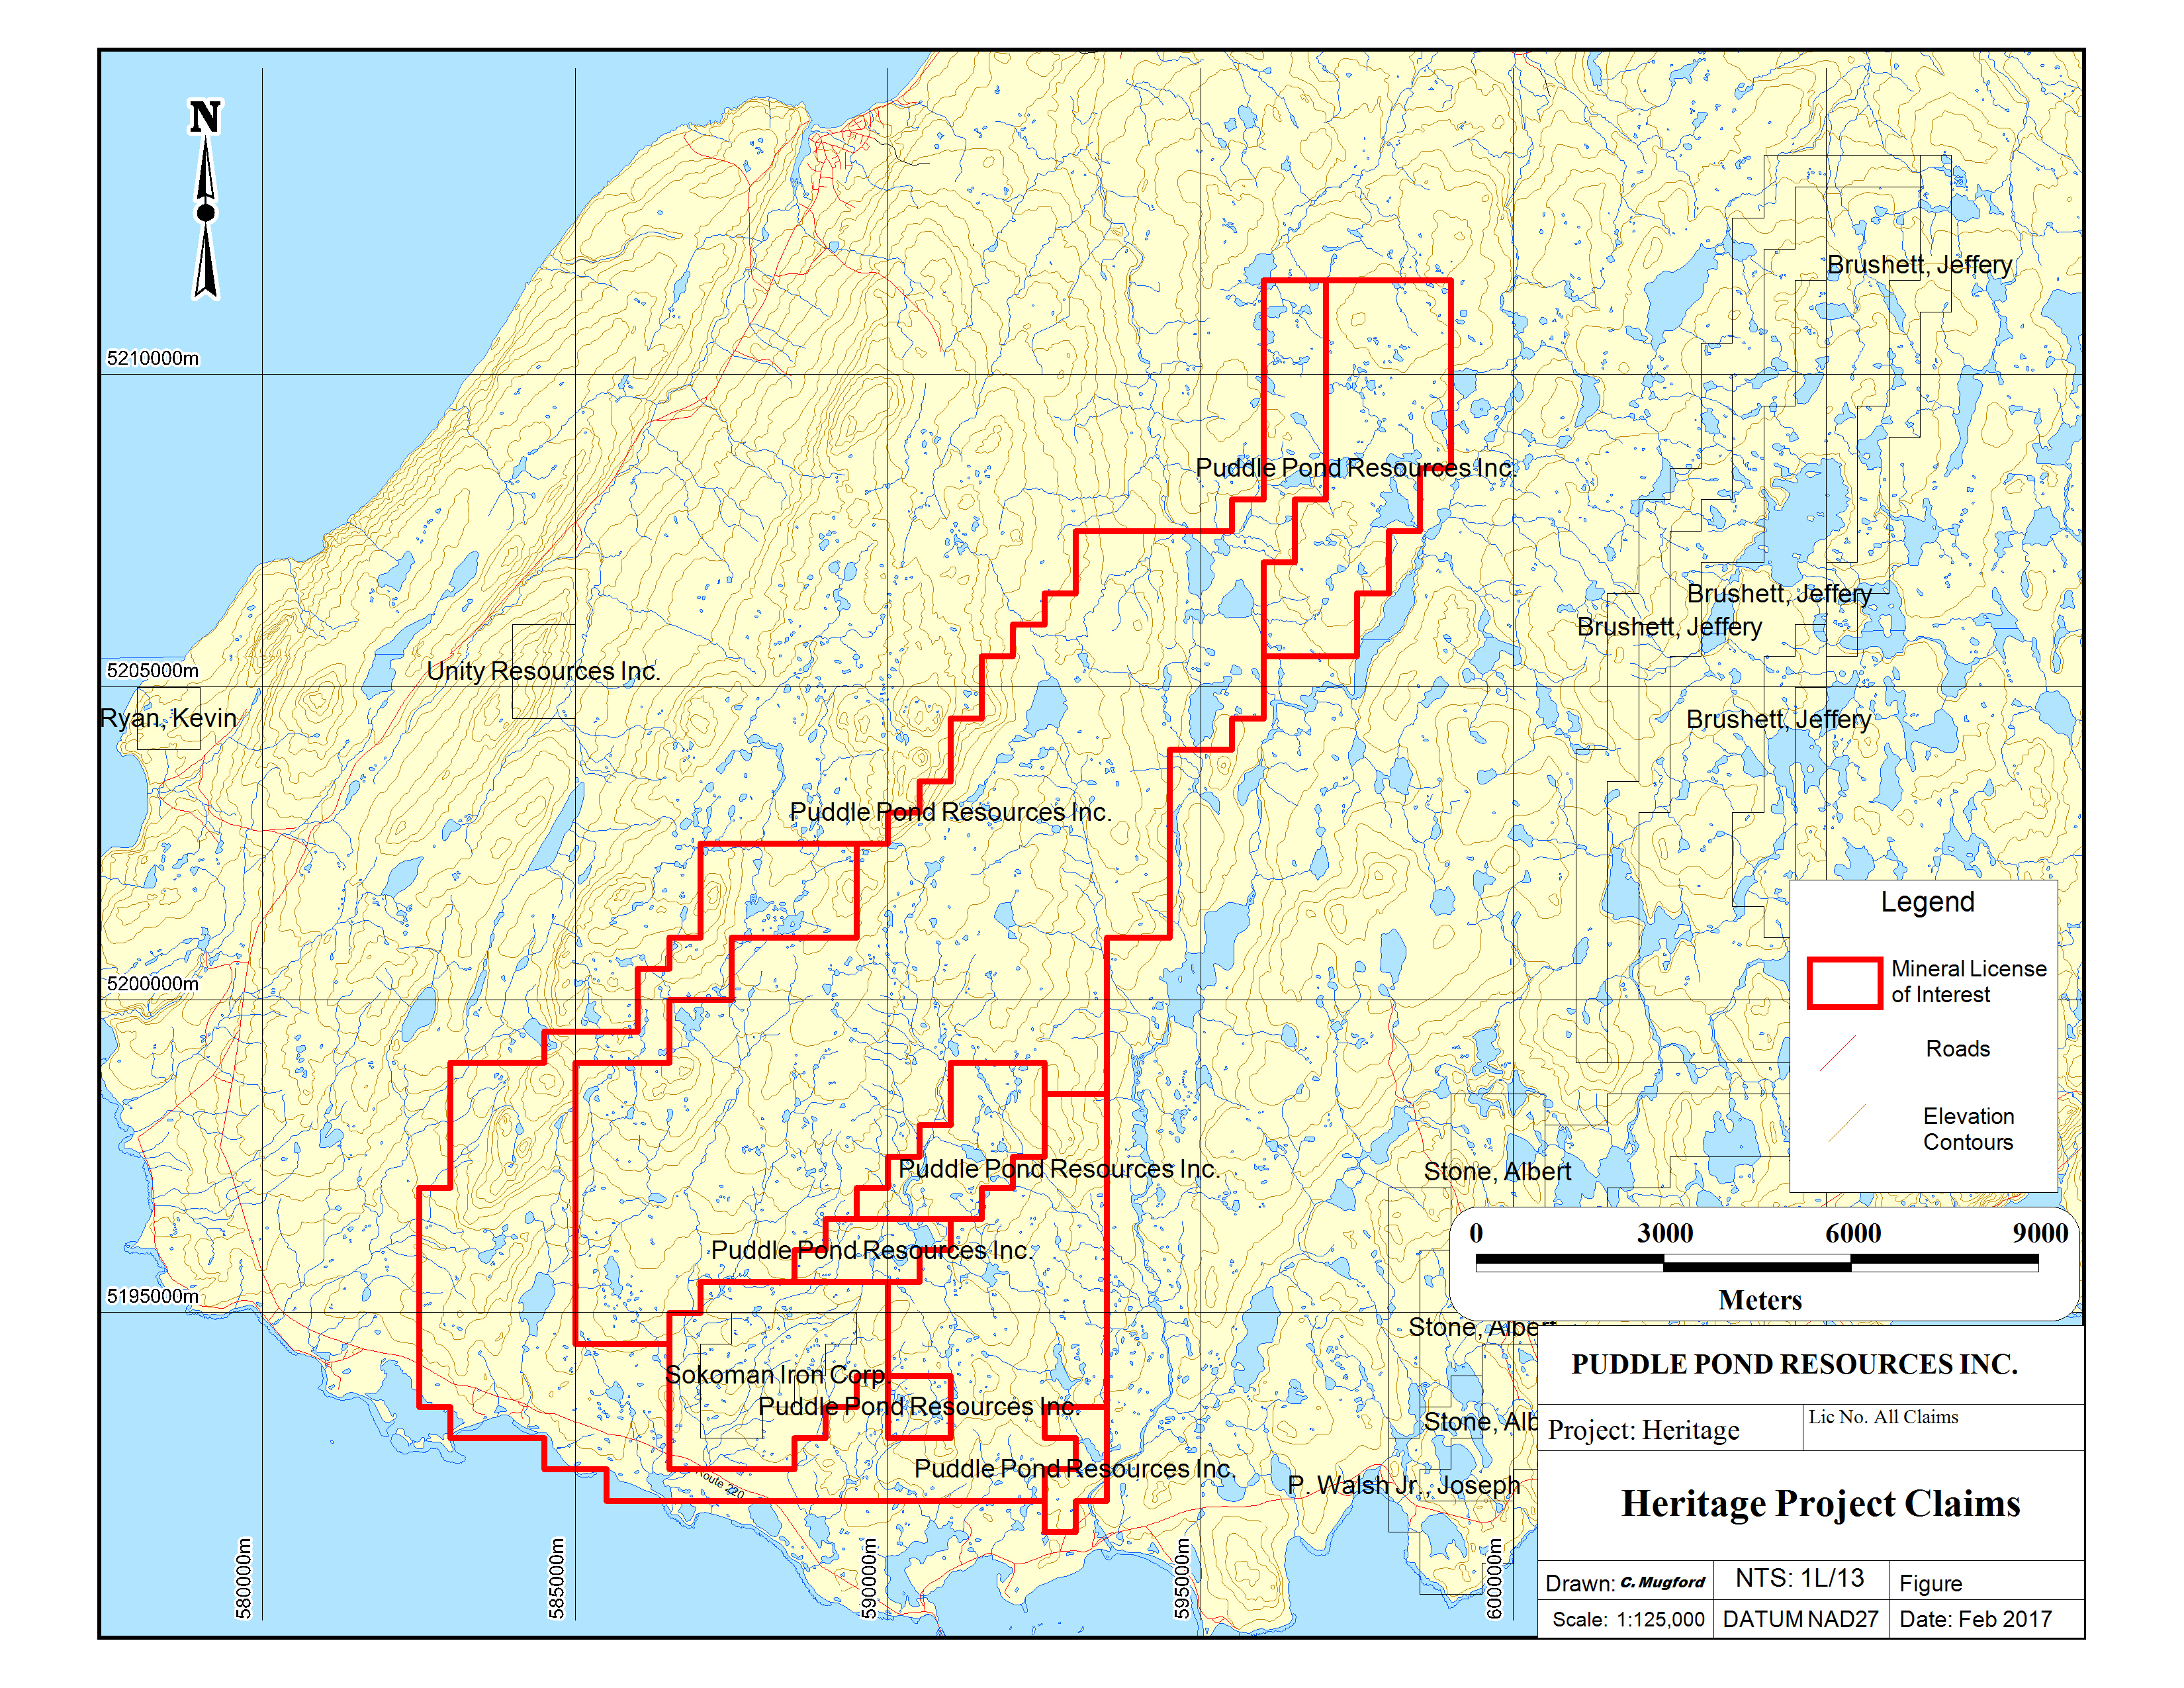
Map showing the 487 claims comprising the Heritage Project which extends 22 km north from the south boundary along the shoreline of the Atlantic Ocean and the Burin Peninsula paved highway skirting along the south end of the property. The property attains a maximum width of 10.5 Km east-west, the Heritage Project covers 30,559 acres or 12,372 hectares representing one of the larger gold silver properties in Newfoundland.
Ground Survey Induced Polarization (IP) Data
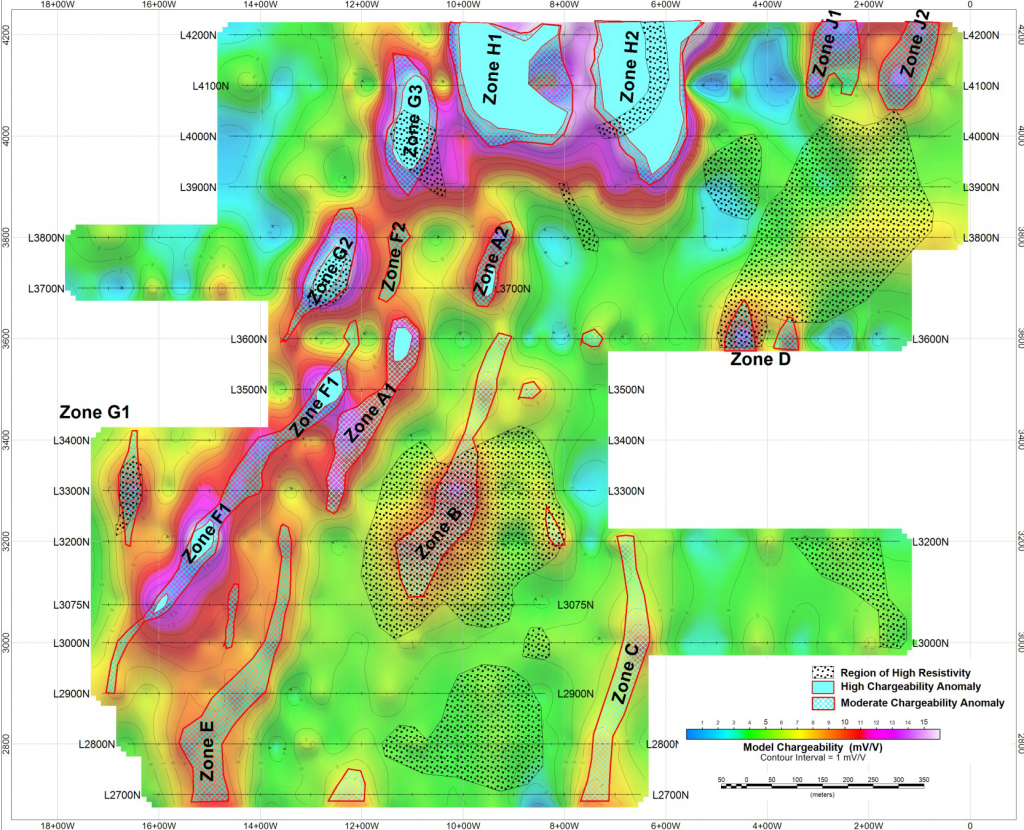
IP Chargeability Anomalies
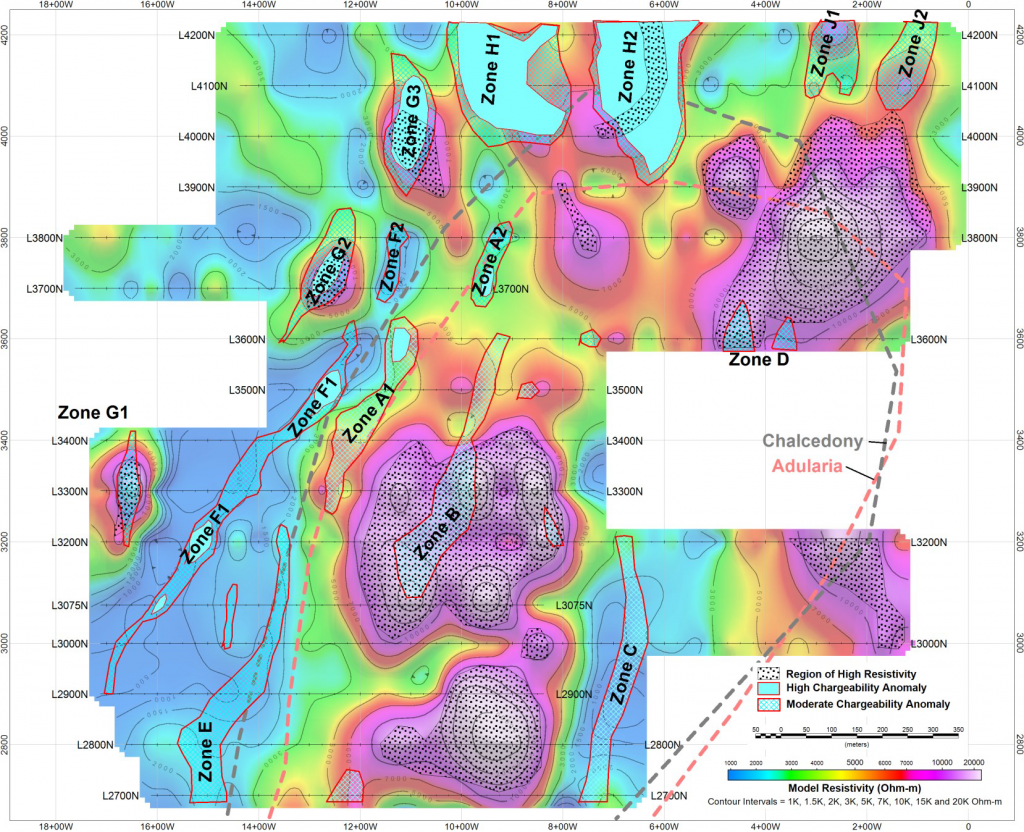
IP Resistivity Anomalies
The IP data is collected by inducing an electrical current into the underlying bedrock and measuring the chargeability and resistivity responses produced by the electrical current. High chargeability are produced by high metal contents mainly from the pyrite (iron sulphide) content and high resistivity by the quartz veins and silica (quartz) alteration common host to the gold and silver mineralization in the PMES. Interpreting and modeling the high IP responses lead to outlining IP anomalies that represent either high charge or high resistivity zones. These anomalies are labelled on the diagrams above and represent areas or zones that are considered to high priority drill targets. Note that Zone A1 is the Eagle Zone where drilling to date has outlined a mineral inventory of 76,074 ounces of equivalent gold and demonstrating the success of IP data detailing drill targets that represent concentrations of gold and silver. The IP results (together with the magnetic survey results) indicate there are many other drill targets with the potential to host significant concentrations of gold and silver.
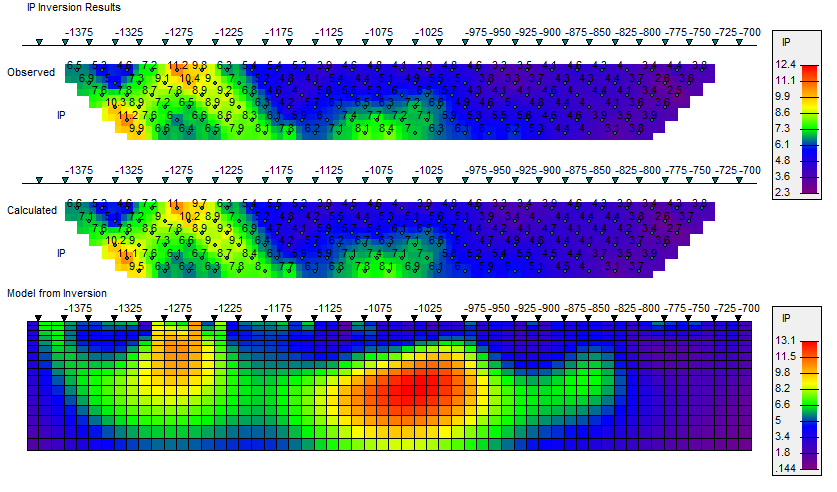
IP Inversion Results
These diagrams represent an example of cross sections or slices through the IP anomalies modelled by the IP consulting firm which show the anomalies and different depths below surface. Along this particular section the depth below surface projection or inversion of the data shows there are at least two drill targets on this section highlighted by the red colored regions. The below surface detailing of these anomalies is a further control on precisely fixing targets for follow-up drilling.
2016 Ground Magnetic Survey
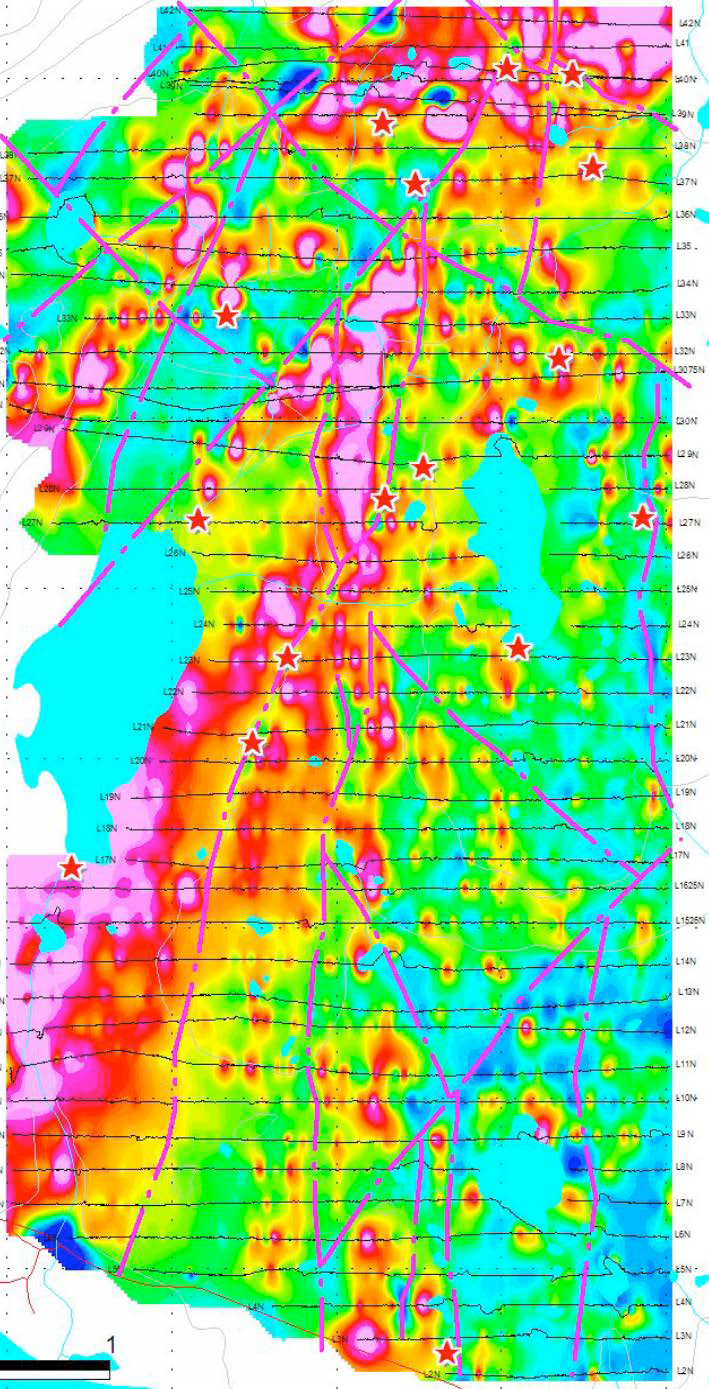
Map showing ground magnetic survey over the 4.5km x 2.5 km Point May Epithermal System. The red stars represent the prospects and their location relative to structures (dash lines) mapped by the survey. These structures are important for sighting the gold and silver mineralization. Red regions are areas of high magnetic responses and blue regions are low magnetic responses. These magnetic trends or regions assist with identifying gold and silver mineralized zones.

Compilation map of structures and alteration zones outlined by the 2015 magnetic survey over the PMES. Over the north half of the grid the Induced Polarization Anomalies outlined by the 2015 IP survey are overlain on to the MAG survey results and the combination of the results from both ground geophysical surveys provides the information necessary to more precisely outline the mineralized prospects/zones, and defined drill targets. The prospects are labelled and the white elongated ellipsoid shows the extent of the Eagle Zone to date. The 2016 discoveries at the Cabin Zone and Trail Zone are also shown with best assay values in Au and Ag.
The results of the geophysical surveys over the 4.5km by 2.5km grid covering the PMES. show the magnetic and IP responses, together with structures and alteration zones are extending north and south beyond the survey coverage and therefore demonstrating the mineralization and alteration is more extensive. The Trail Zone to the west of the grid coverage and the North Star Prospect 17km north of the grid confirms the potential for wider spread mineralization.
Eagle Zone Drill Plan and Representative Sections for 2013 - 2016 Drilling
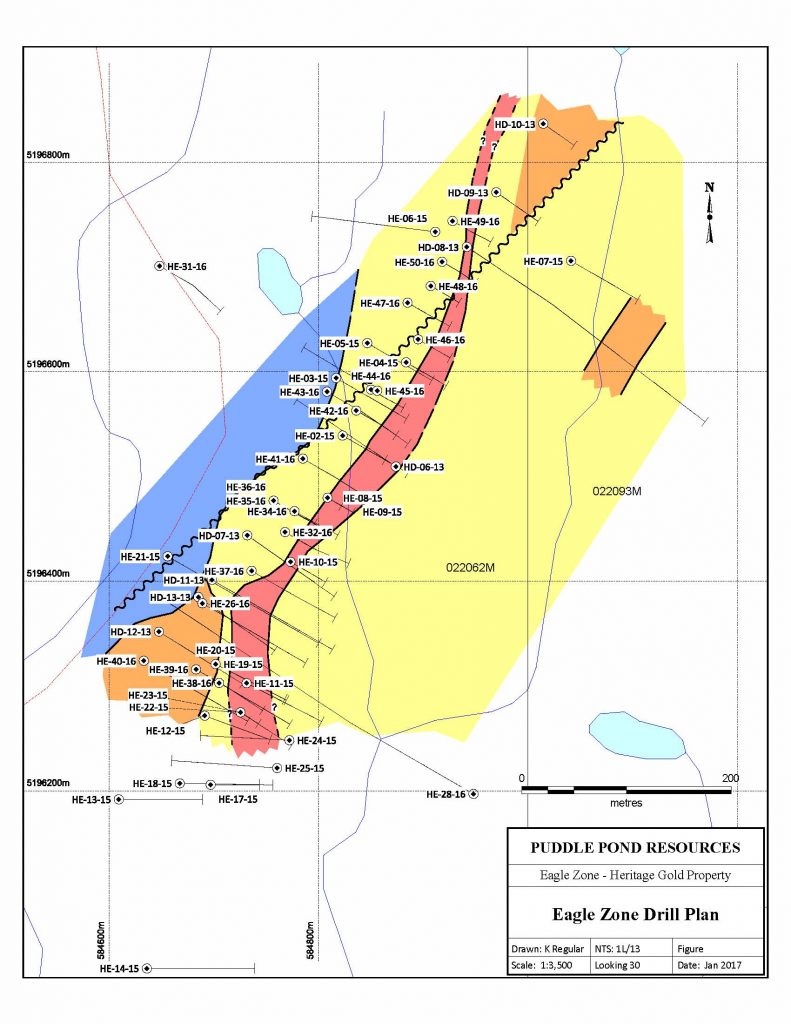
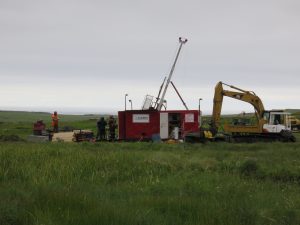
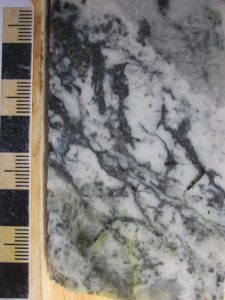
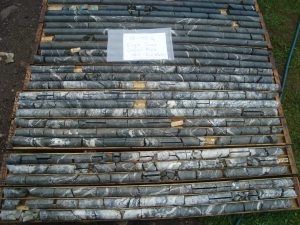
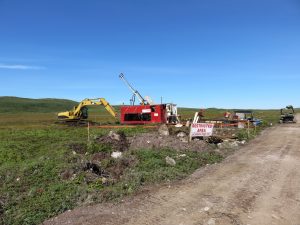
Map showing 500 metre section of the Eagle Zone (fuschia color) tested to date with 53 holes drilled in 2013 (8), 2015 (25), and 2016 (20) successfully testing the zone to a vertical depth of 175 metres. To date a total of approximately 6,500 metres of NQ size drill core has been drilled and sampled resulting in more than 3,000 core samples being assayed for gold and silver. The drilling to date and the results from the ground geophysical surveys show the zone is open along both the north and south strike directions and at depth, and showing indicating potential for a larger zone of gold and silver. The representative sections displayed show the mineralization extends from surface to the vertical depth tested to date. The assay results confirm multiple zones of gold and silver with values ranging up to bonanza grades for both of these precious metals.
This section of the Eagle Zone drill detailed to date provides the information used by P&E Mining Consultants Inc. of Brampton Ontario to calculate a mineral inventory estimate of 76,074 ounces of gold equivalent mineralization further detailed below.
Examples of Drill Sections from 2013 - 2016 Drilling at Eagle Zone
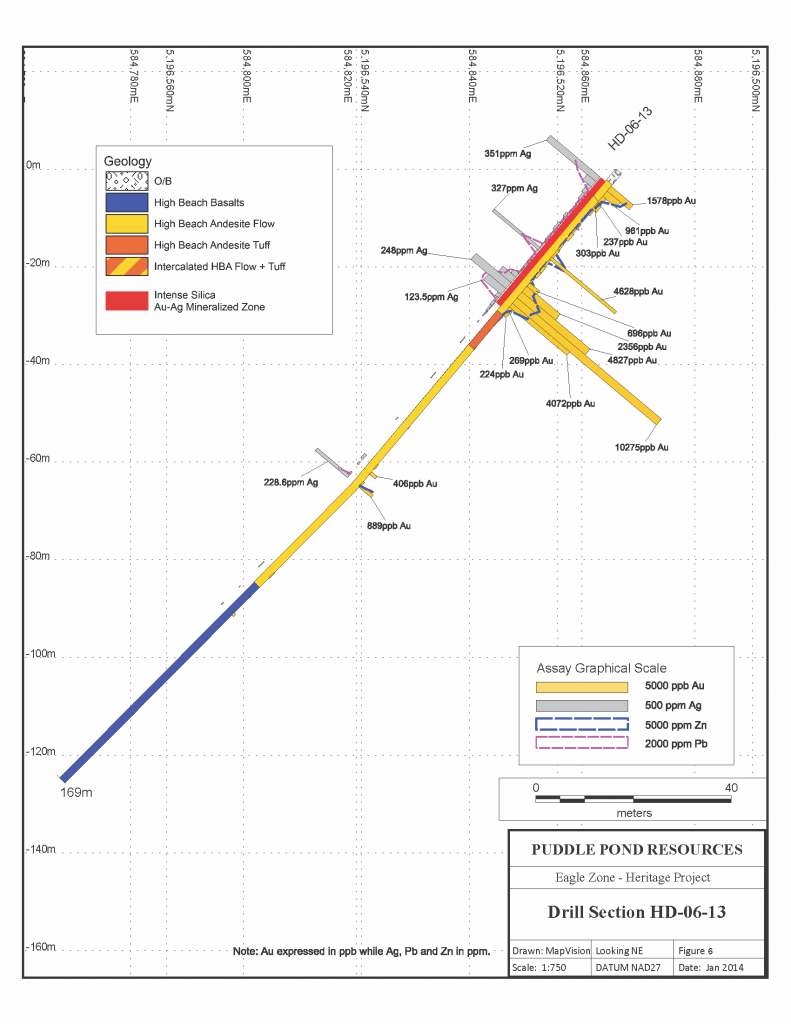
Discovery Hole HD-06-13 intersected the Eagle Zone on surface.
Note: 1 ppm Ag = 1 g/t Ag & 1,000 ppb Au = 1 g/t Au
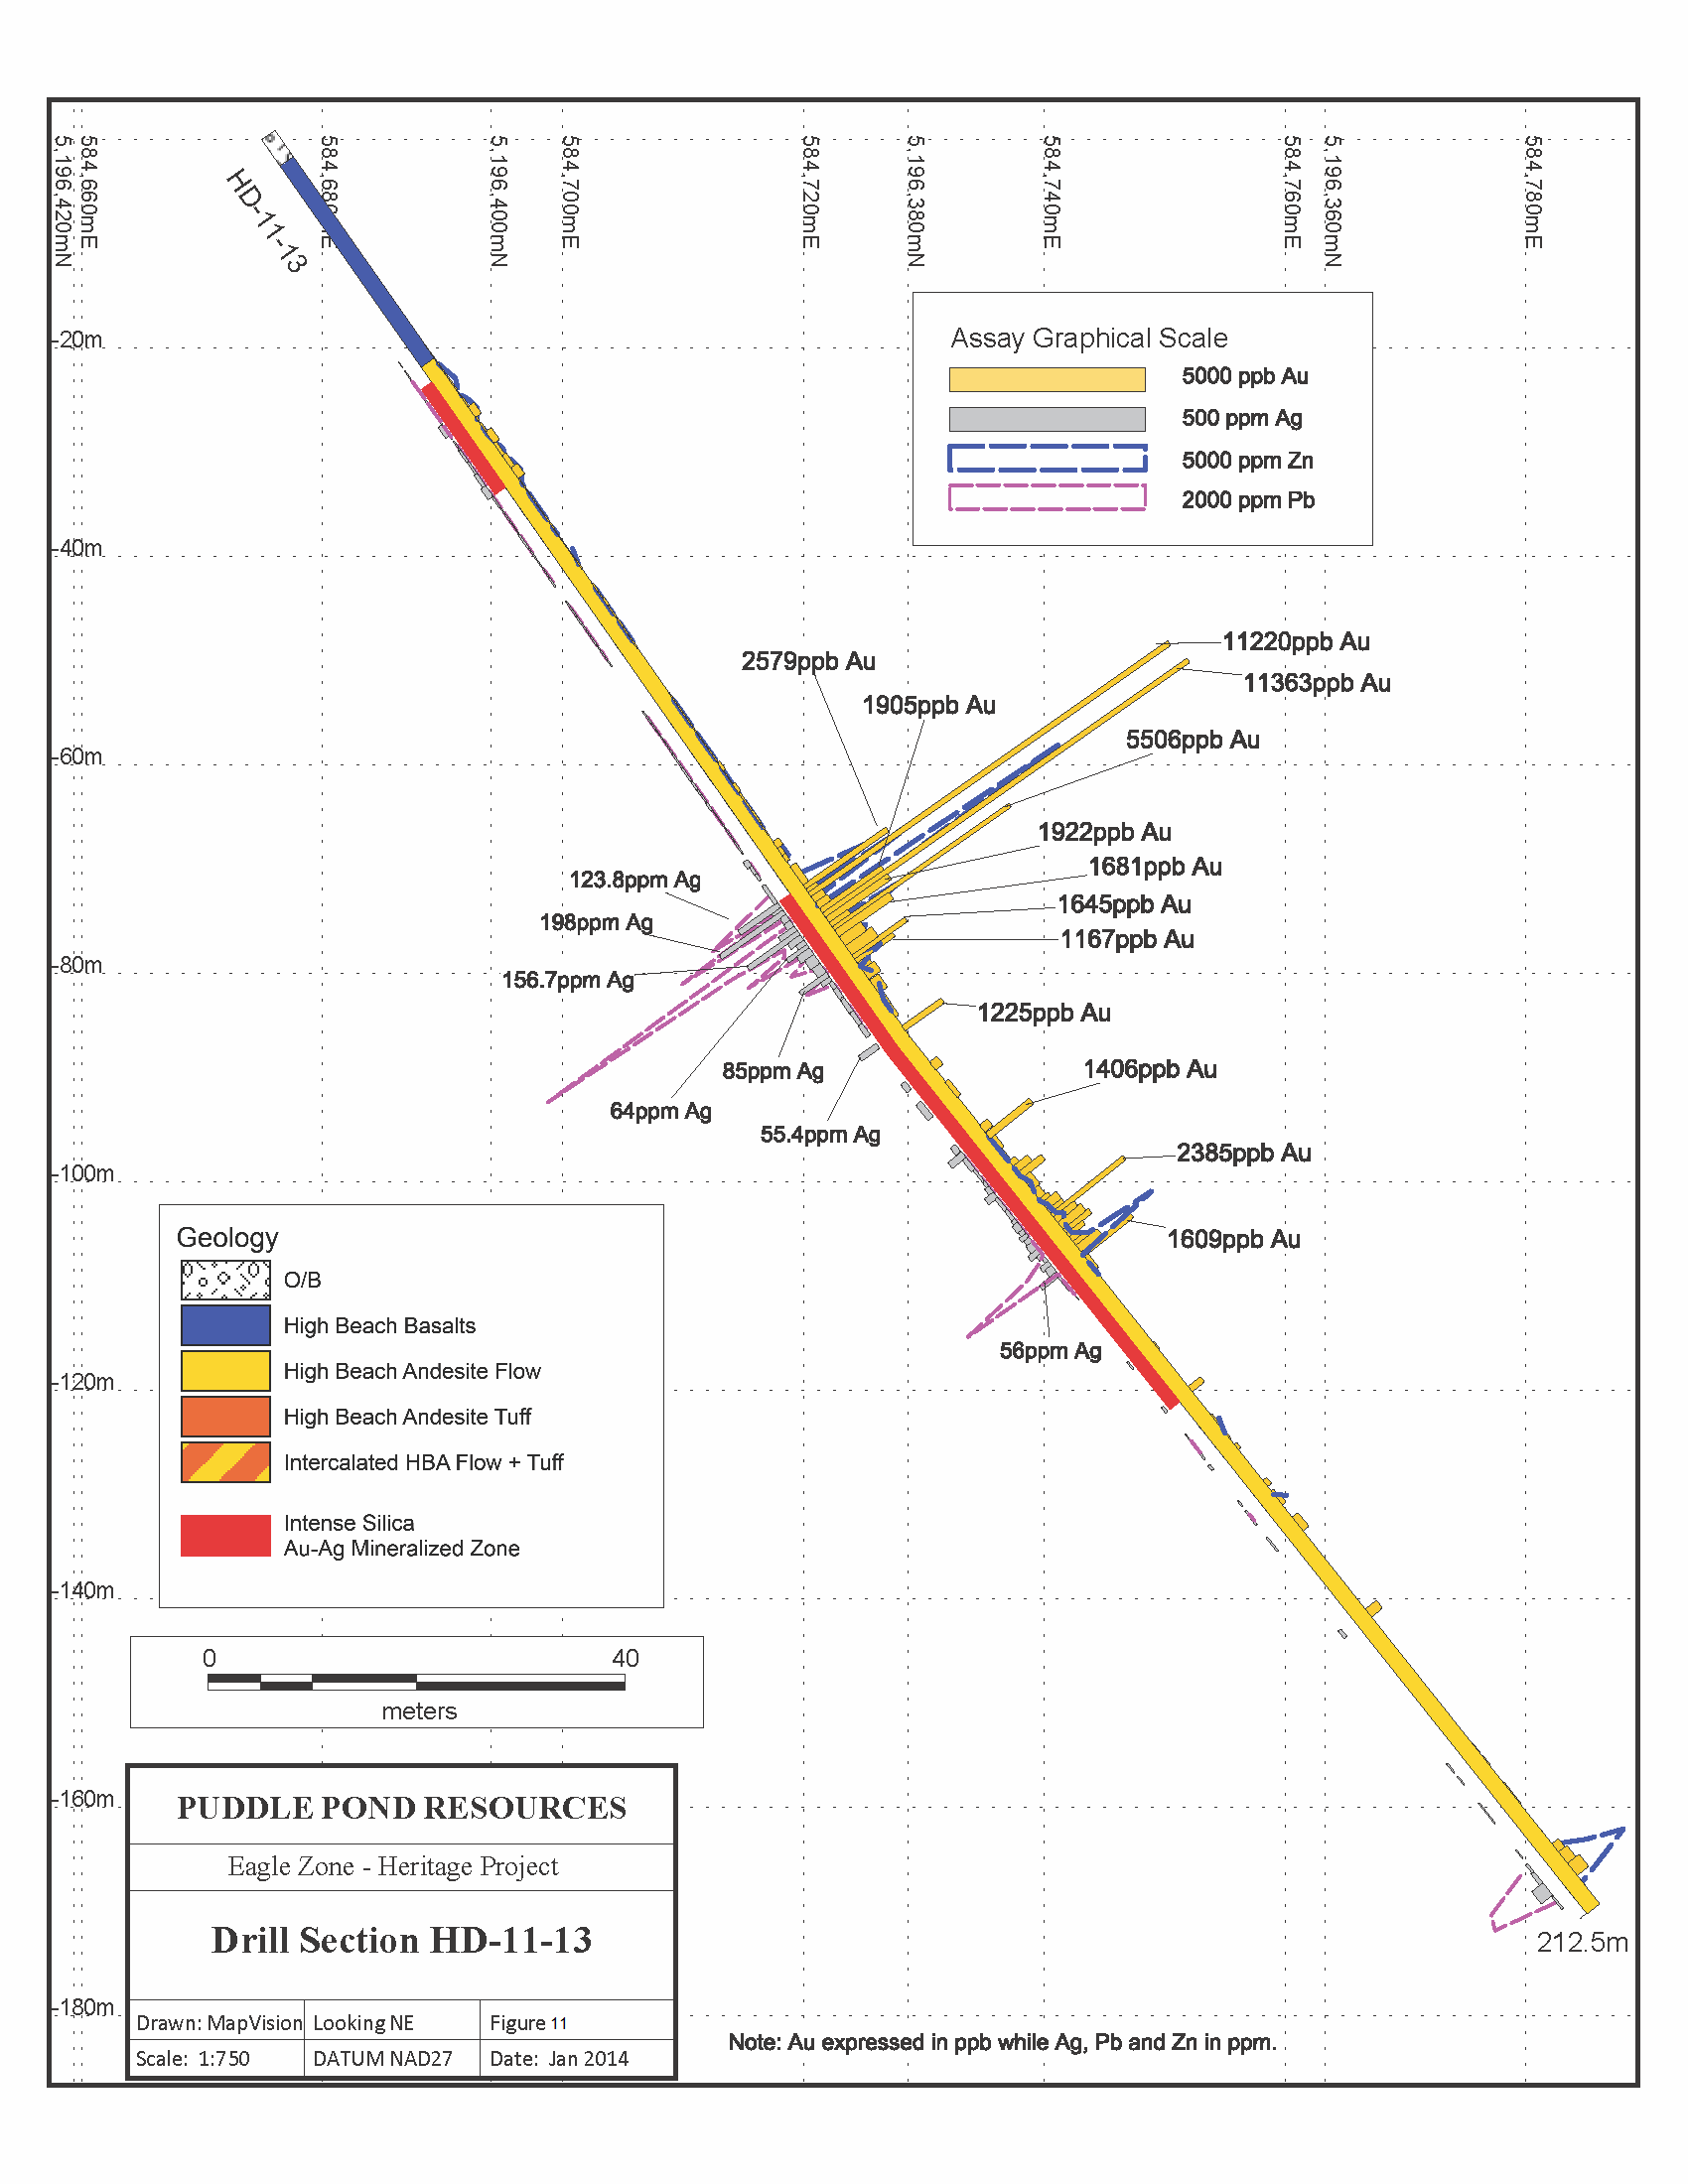
Hole HD-11-13, 1 of 8 holes drilled at Eagle Zone in 2013 intersected the Au & Ag zone at a vertical depth of 75 to 110 metres and containing sections of strong Au & Ag.
Holes Drilled in 2015 following up on the success on the first phase of drilling continued to intersect the Eagle Zone Au & Ag mineralization
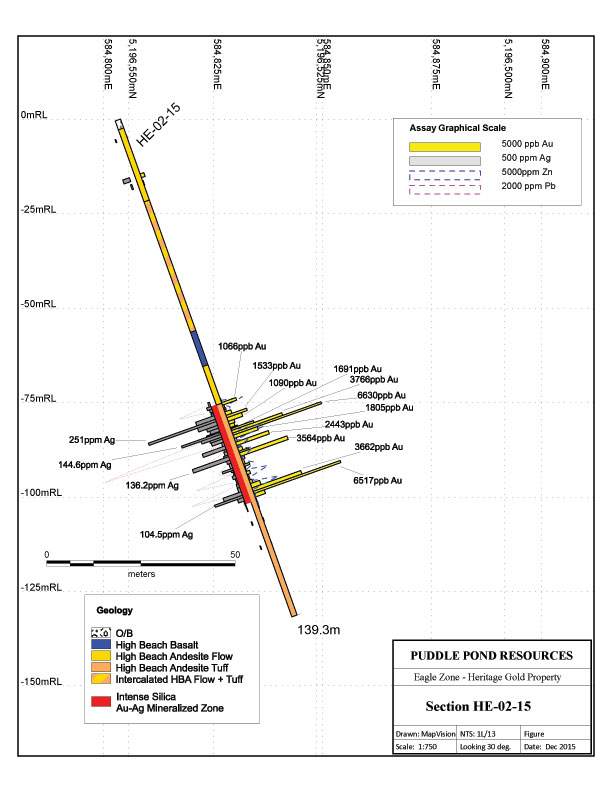
2015 hole HE-02-15 intersected strong Au & Ag from 75 to 100 metres vertically and further confirming mineralization at deeper depths below surface.
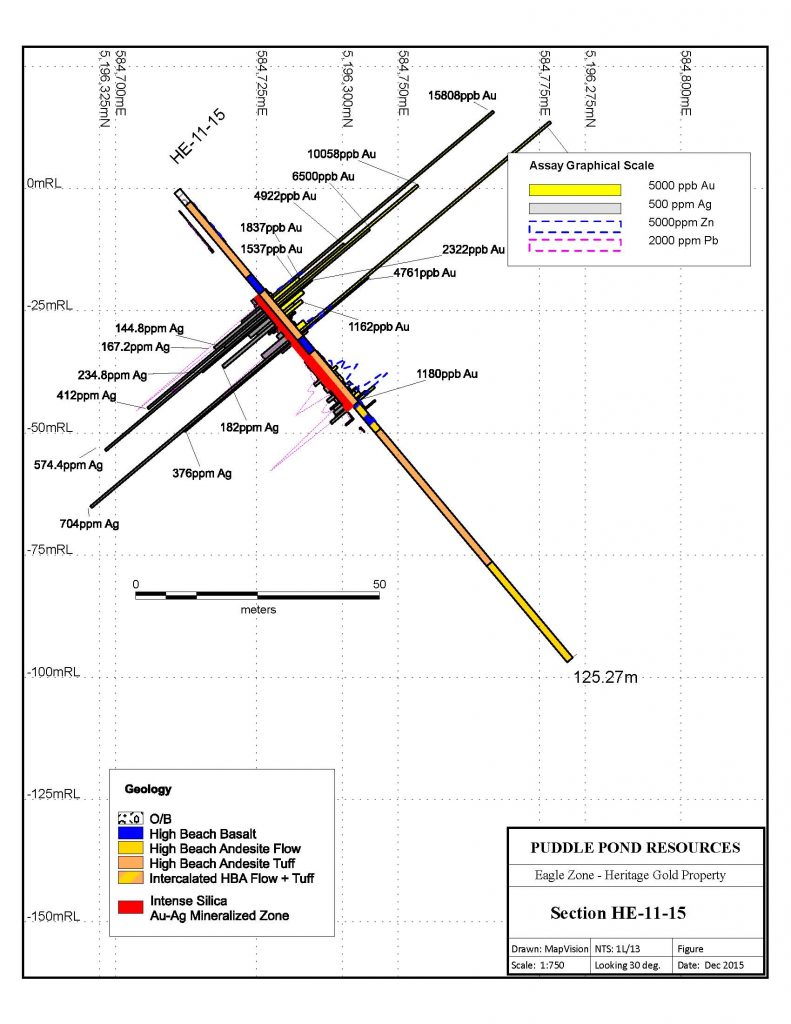
2015 hole HE-11-15 resulted in another strong intersection near surface and with a best Au value of 15.808 g/t and Ag at 574.4 g/t.
2016 Drilling at the Eagle Zone sufficiently detailed the mineralization to allow establishing an Au-Ag mineral inventory
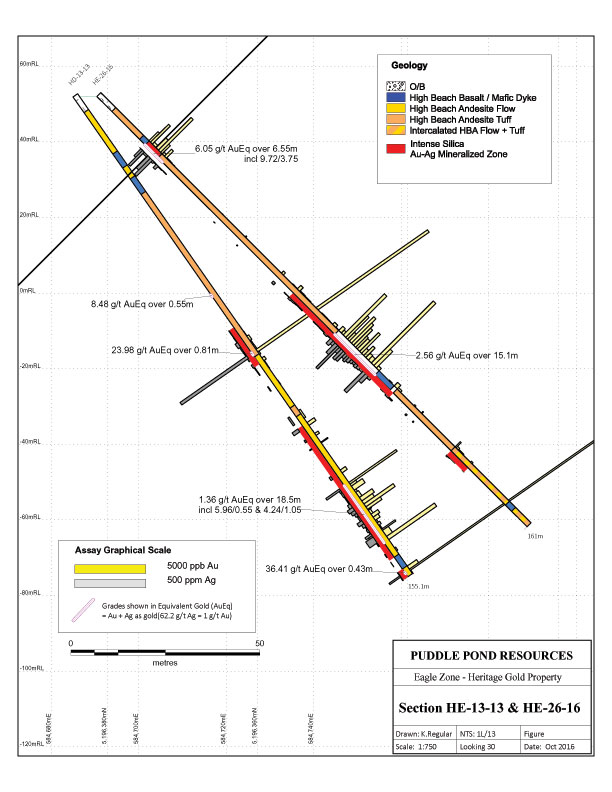
2016 hole HE-26-16 drill on section and up dip from 2013 hole HE-13-13 demonstrated the dip continuity and multiple zones of mineralization first intersected in 2013. HE-26-16 also intersected a spectacular Ag assay of 10.516 Kg/t accompanied by 46.5 g/t Au and representing the best bonanza grade intersected to date. This 20cm rich sample is within a thick 6.55 metre section grading 6.05 g/t Au Eq (equivalent gold) and only several metres below surface.
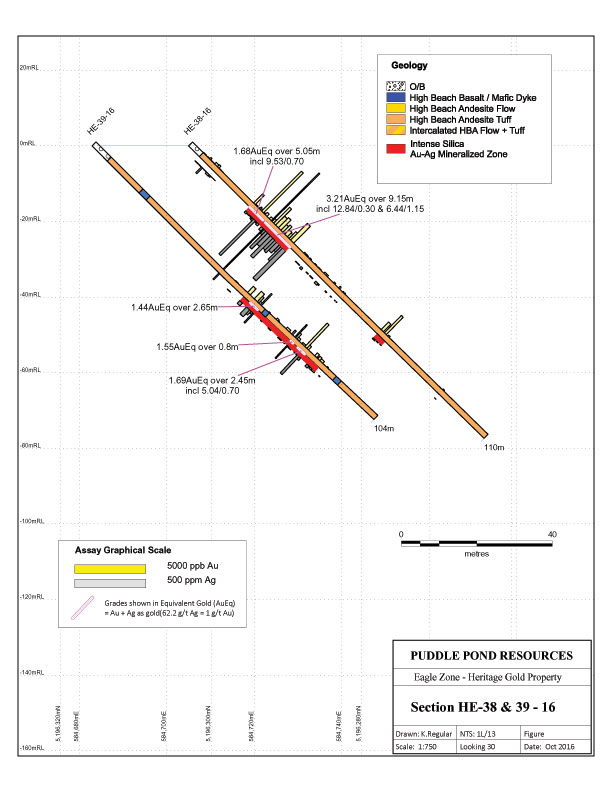
2016 holes HE-38 & 39 – 16 drilled on the same section also shows the dip continuity of the mineralization and these two holes drilled at the south end of the mineral inventory block importantly demonstrates the potential for the Eagle Zone to continue south.
Sections with more than 3 holes still further detail dip continuity of the Eagle Zone Au - Ag mineralization
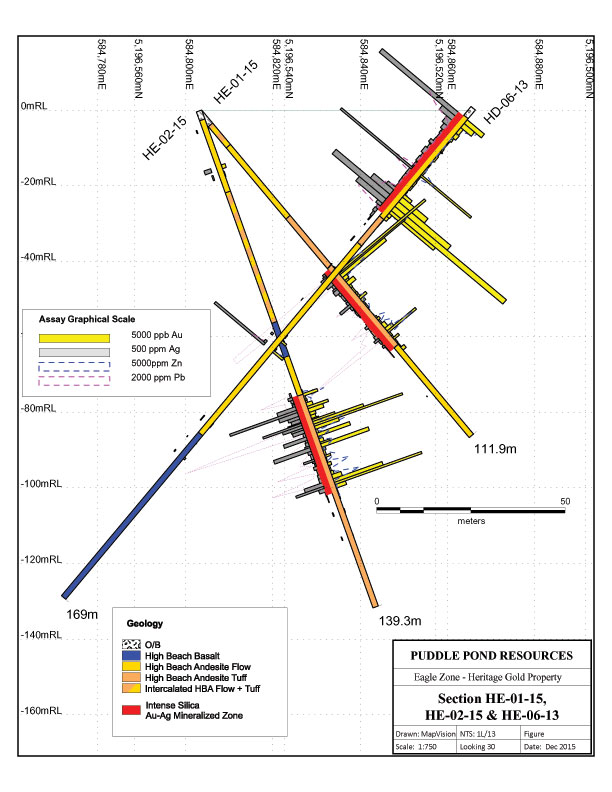
This section which includes 2013 discovery hole HD-06-13 and two 2015 holes further demonstrate the dip continuity and also with the thicker intersection in the deeper Tier 3 hole HE-02-15 shows the potential for the zone to extend deeper below 100 metres vertically
Eagle Zone Drilling provides sufficient detail to calculate a mineral inventory estimate
The drilling program focused on the Eagle Zone since 2013 and totalling 6,850 metres in 53 holes has provided sufficient detail to calculate a mineral inventory estimate of gold and silver over a 500 metre section of the zone drill tested to date. P&E Mining Consultants Inc (P&E) of Brampton, Ontario, Canada was retained by the company to process the drill data for the purpose of calculating the mineral inventory, the outline of which is presented in the 3D block diagram below.
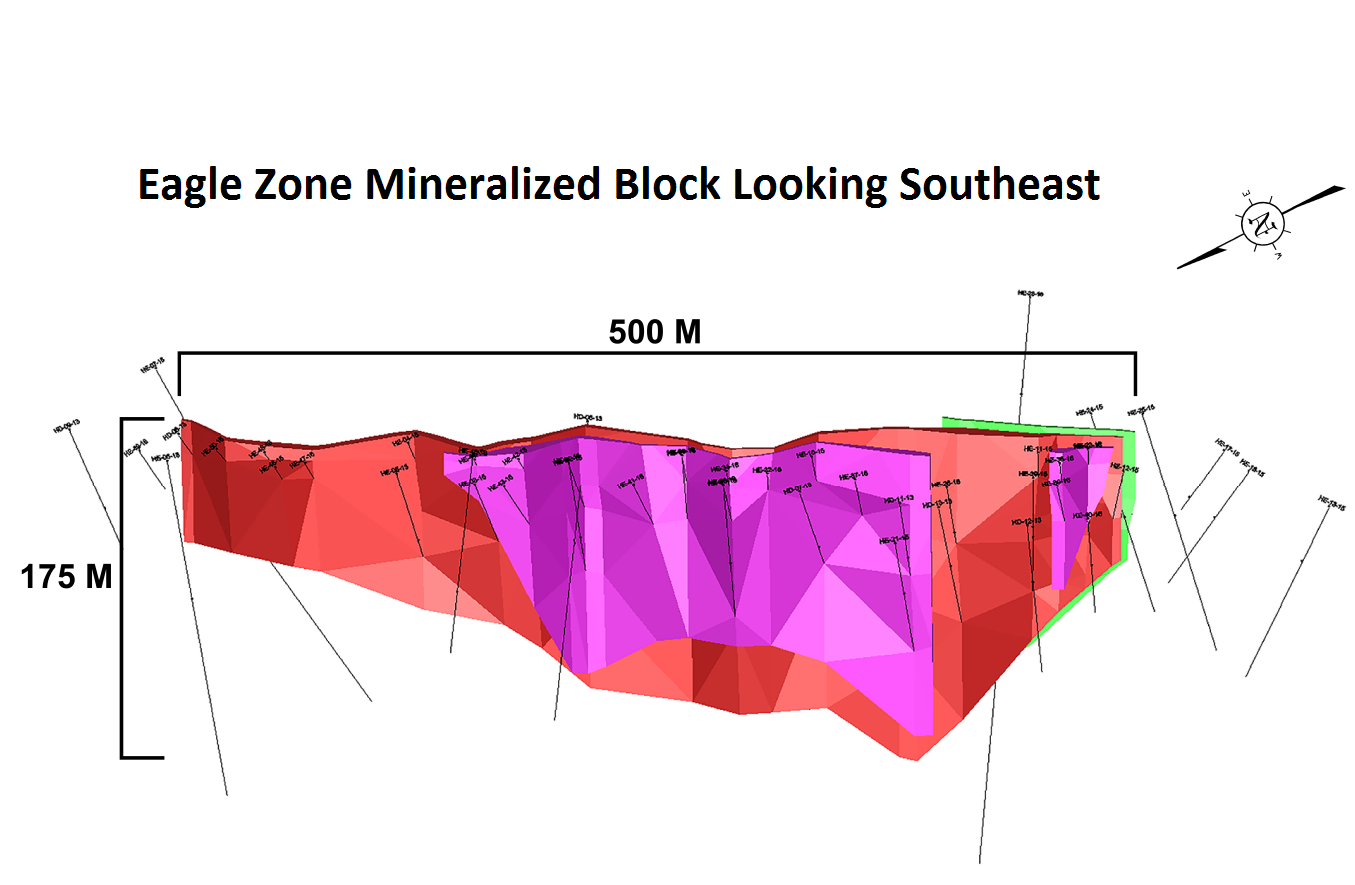
P&E is a well-established consulting company and have conducted similar studies globally. Their processing and modeling of the drill data confirms and estimated 76,074 ounces of gold equivalent mineralization (AuEq), which is gold + silver expressed as gold whereby 70 grams of silver = 1 gram of gold. This AuEq mineral inventory is contained within approximately 1.08 million tonnes at a grade of 2.186 g/t AuEq. P&E concluded that, although not yet an economically mineable resource, the current estimate is accurate given the stage of the project. P&E also concluded that mineralization has not been constrained by drilling and remains open at depth and along strike and potential remains to significantly expand the mineral inventory estimate.


